Concept
The stadium has always been a place of spectacle. It’s function is purely to create a space that optimizes both the viewership of the spectacle and the amount of people. As society has arguably become more about spectacle through the abilities of technology, the stadium has become a monument too the idea of spectacle. The perfect optimization of spectacle, is an excellent monument too a spectacle society. In this project Crowd Noise Visualizer, the objective of the project is too enhance and display the real-time interaction of the crowd too the spectacle. By analyzing the noise of the crowd and converting that data too an audio visualizer light display within the stadium. This will create an interesting relationship of the crowd and event, making the crowd become part of the spectacle and blurring the lines between the two.
Hardware Design
The stadium design that I applied this project too was a hockey arena that hosts up too 6000 people in the main event rink (shown in Image 1).
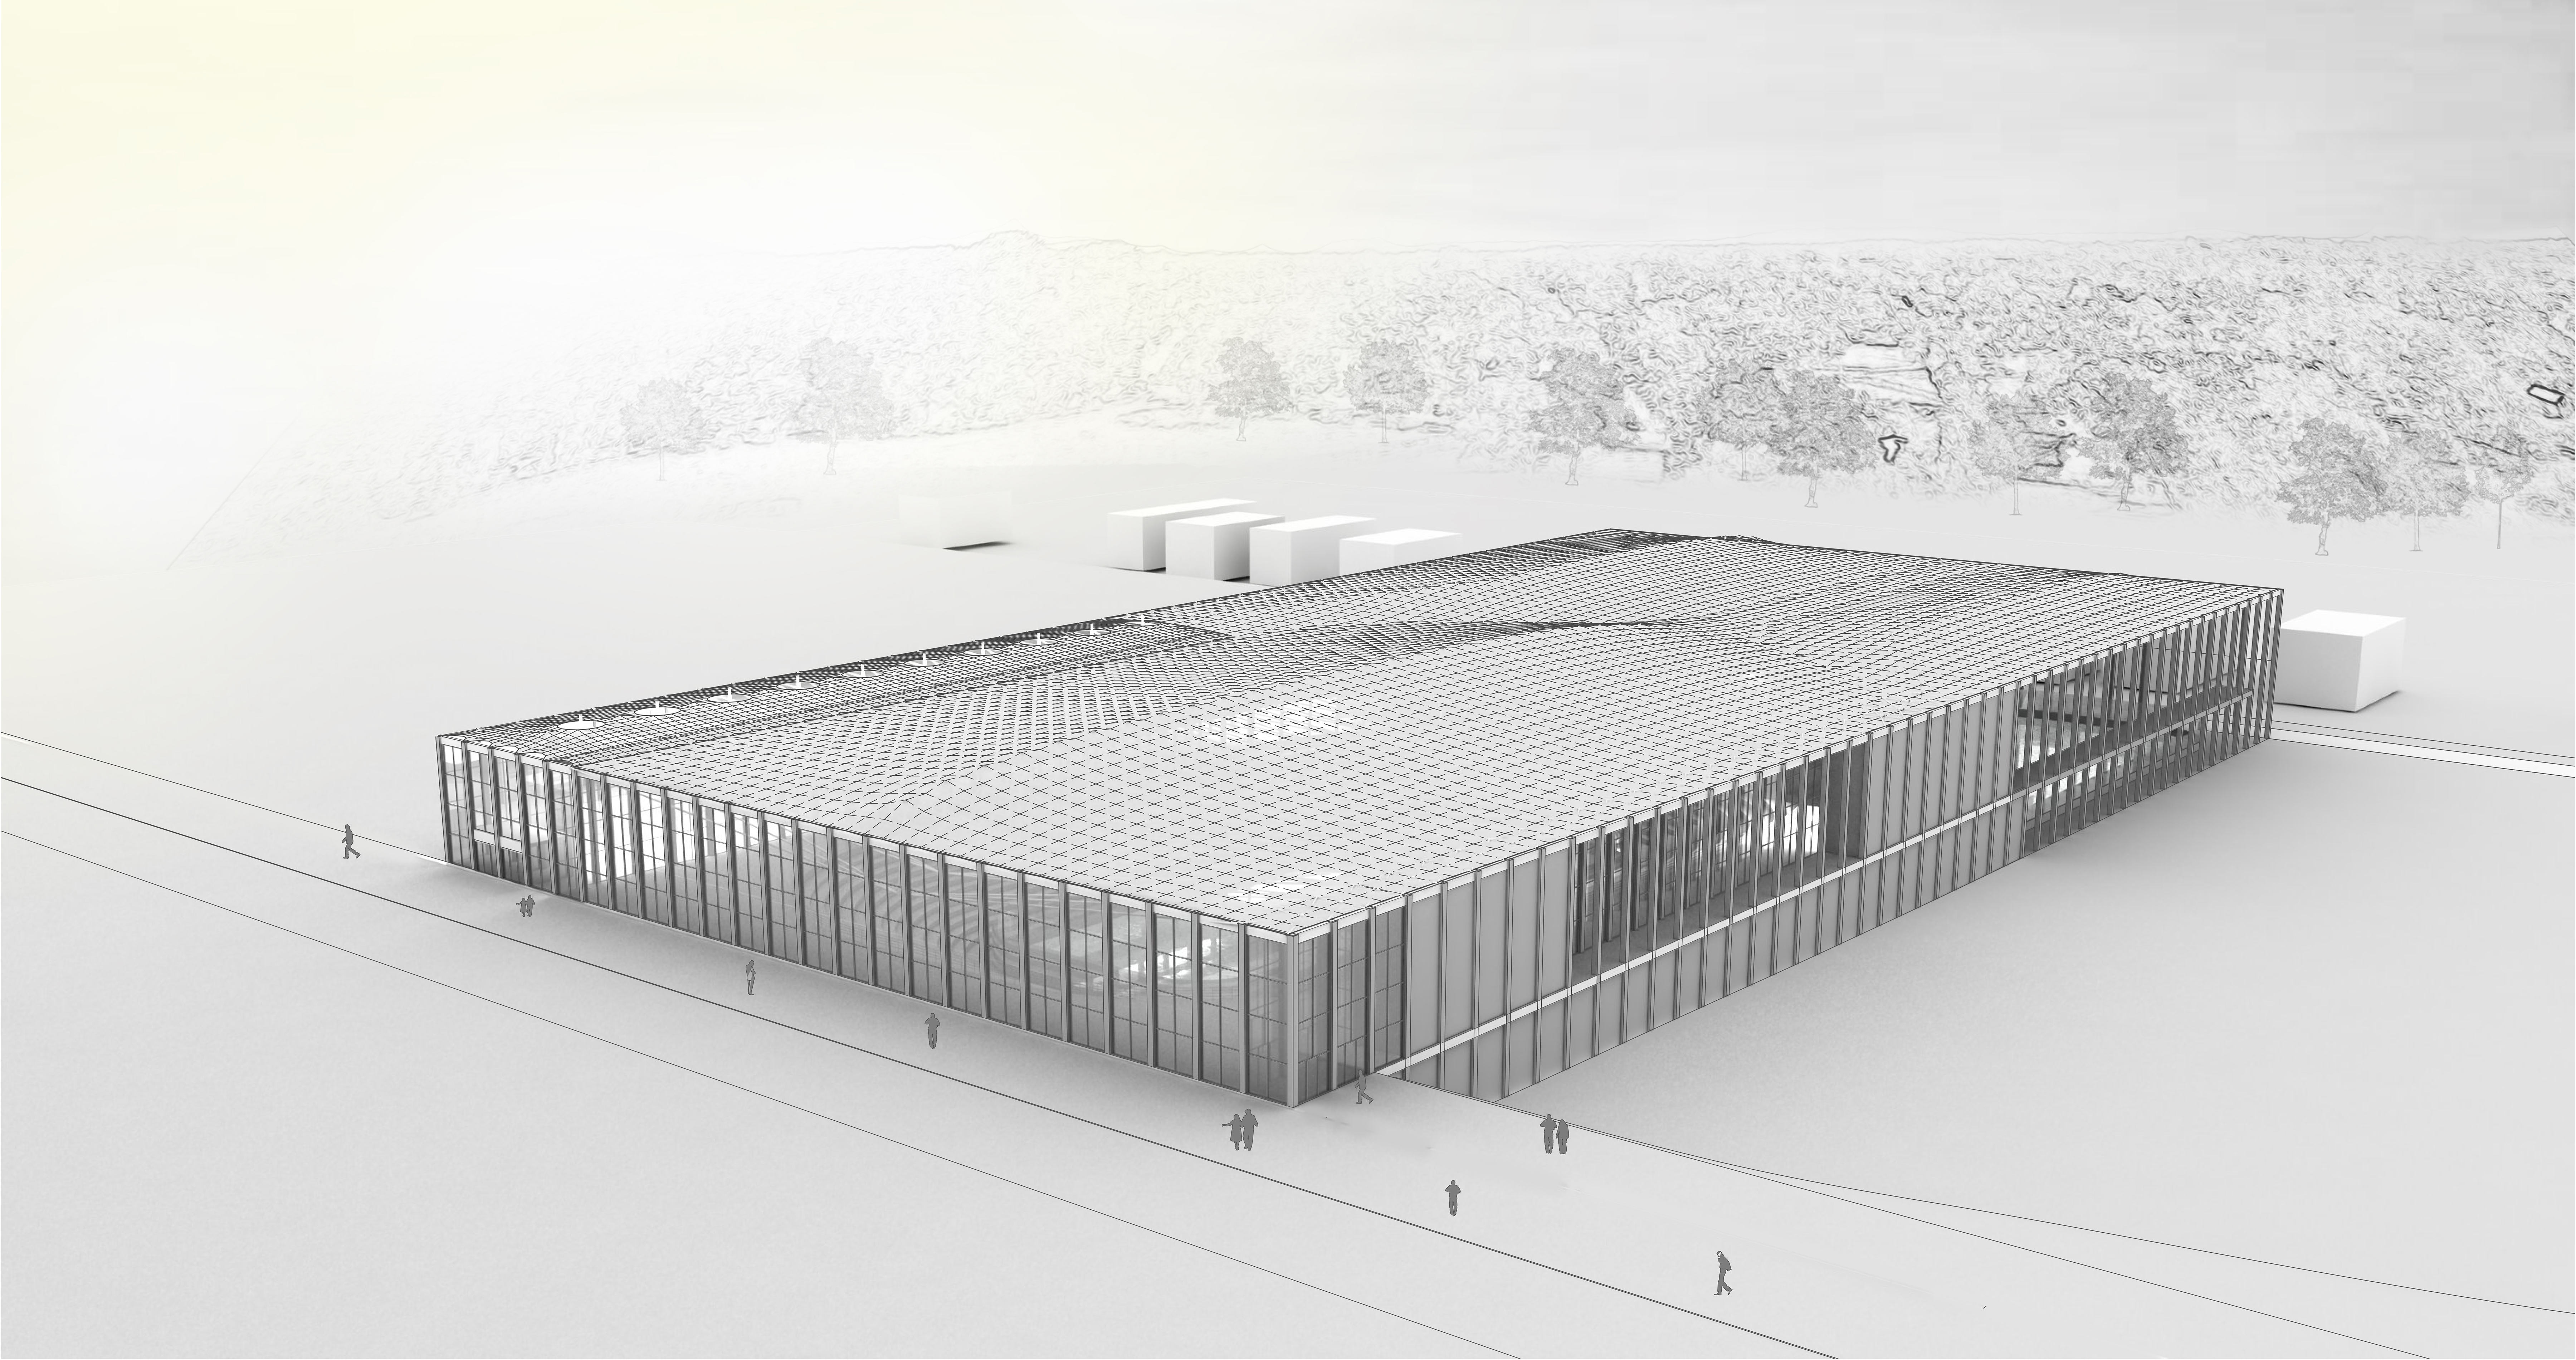
Image 1
To collect the audio or noise of the crowd I needed to place microphones in the stadium. Issues then arose about where the microphones should be placed and what type of microphones I should use. The two types of microphones that I choose from were shotgun (which is a directional microphone with a narrow-angle range of sensitivity) or a omnidirectional microphone (picks up sound evenly from all directions). I decided too select the omnidirectional microphone, because the objective was too get the overall noise level of the stadium, rather then picking up small samples of the crowd noise. To get the overall noise level, I needed to place the microphones slightly away from the crowd so that once again the mics would not pick up small samples. The decision was to place them above the crowd and as part of the roof system (shown in Image 3).
The roof of this building was ETFE fabric roof that had a large span across the rink that used flying masts to create a slope within the roof. The flying masts were held up by cables that are running perpendicular too the length of the rink (shown in Image 2). These cables created a series of plains in space that break up the space into sections. To get the Audio Visualizer to work I decided too use LED strip lighting that would represent a particular band of the audio. So the solution was to place the LED strip lights onto the underside of the cables, that are supporting the flying masts and roof (shown in Image 3). This would allow for the lights to be experienced within the spectacle.
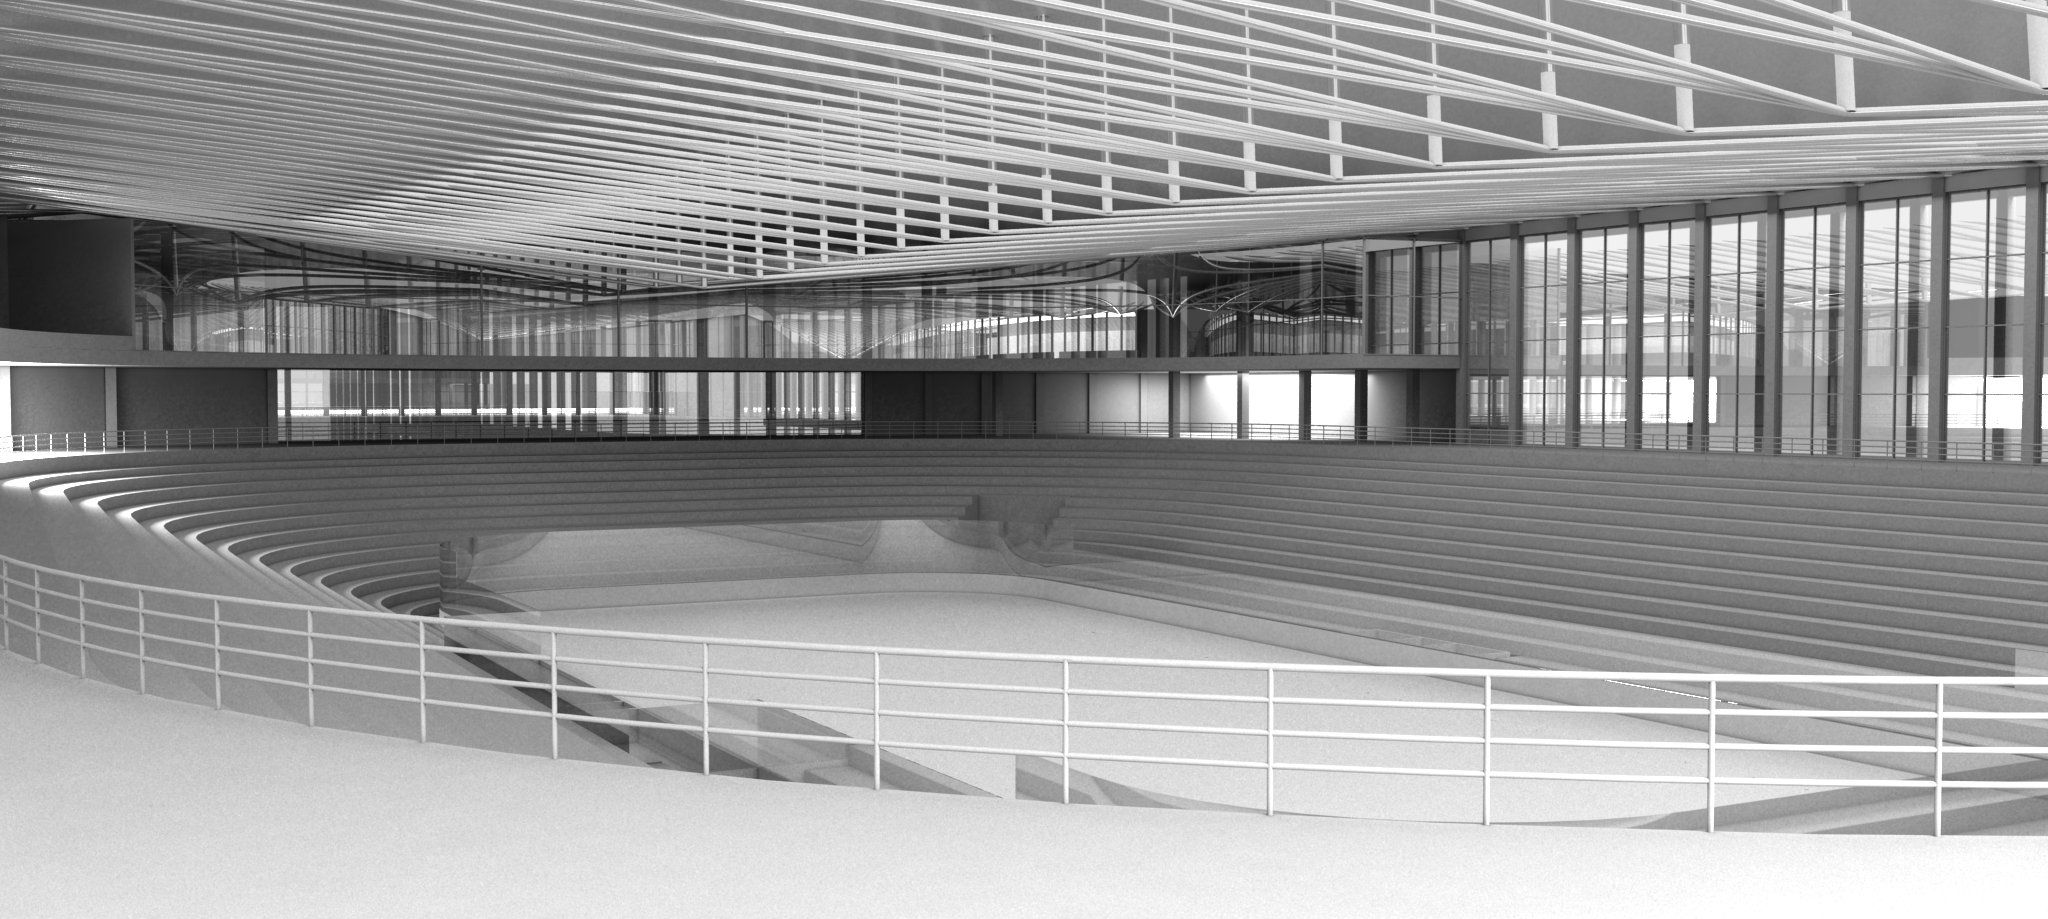
Image 2
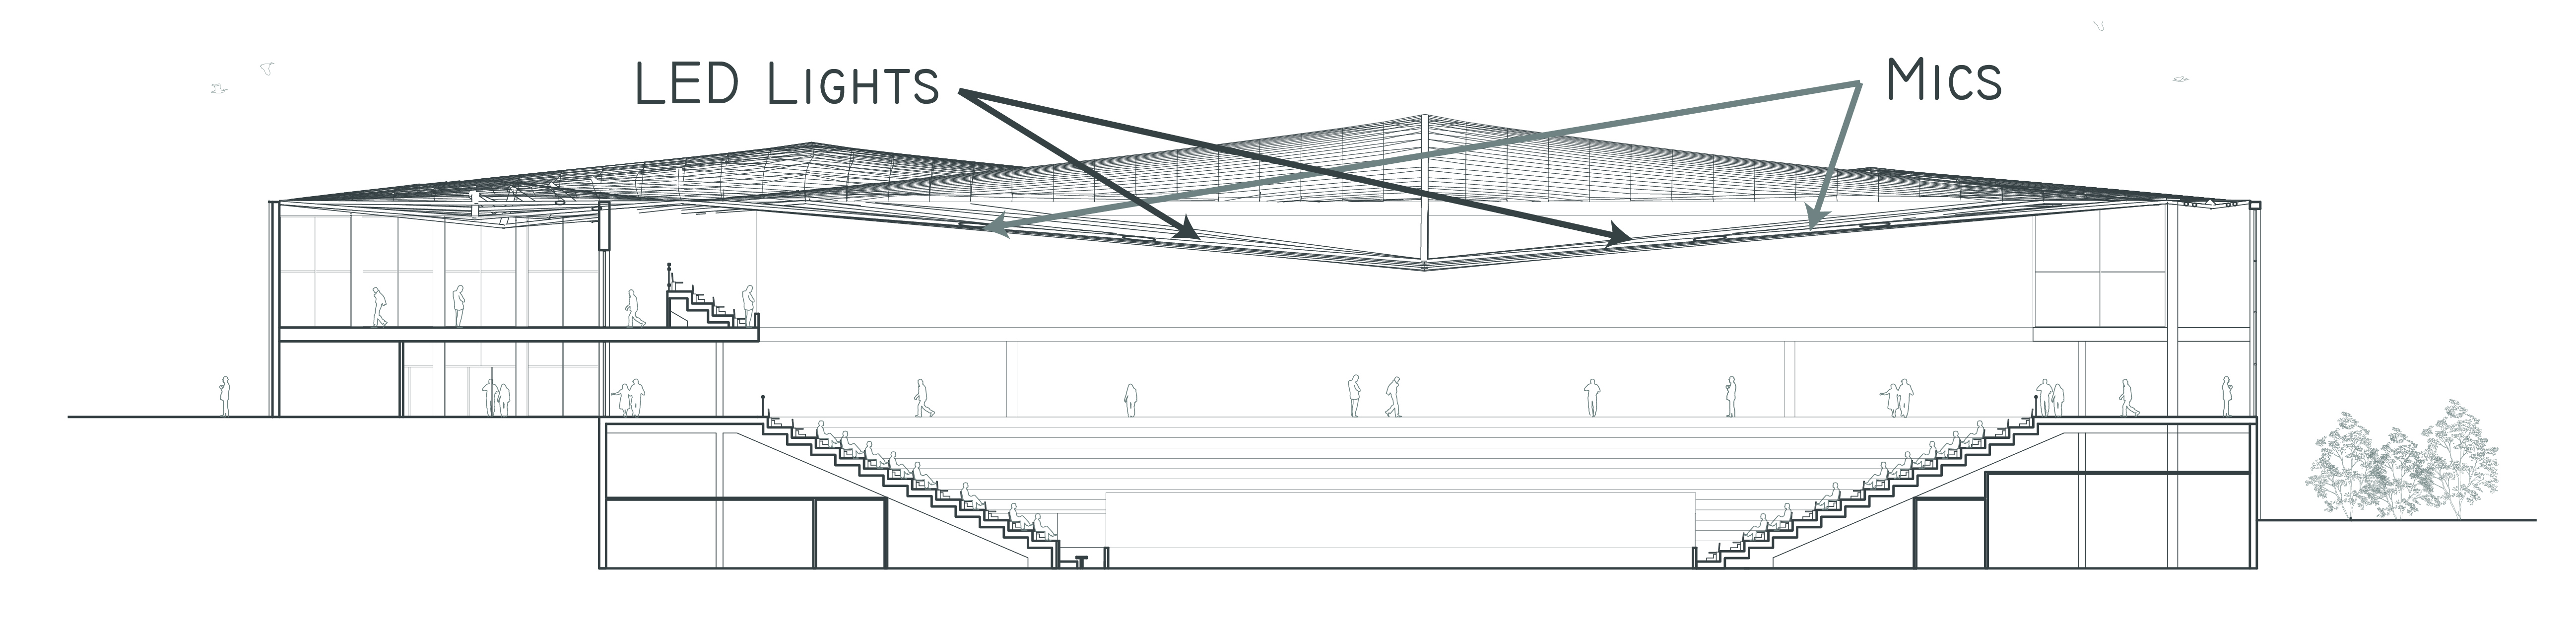
Image 3
Software Design
The design of the software that would solve the issue of how to convert the audio received from the microphones too an audio visualizer of LED light was the next problem to solve. The solution was to use Processing and Minum to process the audio that I received from the crowd to a visualization of the sound. Then I would use Arduino too convert that visualization into a visualization of lights. The Processing and Minum code that I used would analyze the sounds based on frequency bands levels and then convert them into data that could be processed into Arduino. Arduino would take the data received from Minum about the frequency band levels and assign a brightness too the LED lights based on how high the frequency band was.
I had two Minum Processing codes. The first was a code that took the microphone from my computer as the source for the audio. In the stadium, the omnidirectional microphone would replace my computer for the source. This code would be applied during games to the desired crowd noise-audio visualization reaction. A second code was created for different types of spectacle events. A hockey rink may not always be used as a hockey rink, but things such as concerts or public events. For these types of events I decided that perhaps an articulation of the crowd noise and event were not what we wanted, but instead what was needed was a relationship only too the performance. So this second code was created to visualize only the sound of the performer or performance. So if there was an public open skate in the rink, the music playing over the stereo could be the only thing visualized. Another instance could be if there was a concert only the band would be hooked up to the light system. Either way this creates multiple options of how to visualize audio in an arena to create a new dynamic space.
Processing Code 1:
import processing.serial.*;
import ddf.minim.analysis.*;
import ddf.minim.*;
Serial port;
AudioInput in;
Minim minim;
FFT fftLin;
float vectormedias[]=new float[6];
float magnitud=4;
float volumen;
int volcaptado;
void setup()
{
println(Serial.list());
if (port==null)
port = new Serial(this, Serial.list()[1], 9600);
size(512, 300, P3D);
volumen=1;
minim = new Minim(this);
in = minim.getLineIn(Minim.STEREO, 2048);
fftLin = new FFT(in.bufferSize(), in.sampleRate());
fftLin.linAverages(240);
rectMode(CORNERS);
}
void draw()
{
background(0);
fftLin.forward(in.mix);
noStroke();
fill(255);
int w = int(width/6);
{
if (i<=1)
{
if (vectormedias[0]<2*fftLin.getAvg(i))
vectormedias[0]=2*fftLin.getAvg(i);
}
else if (i<=5)
{
if (vectormedias[1]<1.2*fftLin.getAvg(i))
vectormedias[1]=1.2*fftLin.getAvg(i);
}
else if (i<=12)
{
if (vectormedias[2]<1.6*fftLin.getAvg(i))
vectormedias[2]=1.6*fftLin.getAvg(i);
}
else if (i<=22)
{
if (vectormedias[3]<1.75*fftLin.getAvg(i))
vectormedias[3]=1.75*fftLin.getAvg(i);
}
else if (i<=55)
{
if (vectormedias[4]<2*fftLin.getAvg(i))
vectormedias[4]=2*fftLin.getAvg(i);
}
if (i<=160)
{
}
if (i==119)
{
for (byte k=0;k<6;k++)
{ delay(10);
fill(255);
if (in.mix.level()>0.001)
{
volcaptado=int(magnitud*vectormedias[k]/volumen);
if (volcaptado>300)
volcaptado=300;
volcaptado=volcaptado/10;
port.write((k<<5)|byte(volcaptado));
rect(k*w, height, k*w + w, height – magnitud*vectormedias[k]/volumen);
}
else{
volumen=0.4;
port.write((k<<5));
delay(100);
}
vectormedias[k]=0;
}
}
}
}
void stop()
{
in.close();
minim.stop();
super.stop();
port.write(0);
}
Processing Code 2:
import processing.serial.*;
import ddf.minim.analysis.*;
import ddf.minim.*;
Serial port;
AudioPlayer jingle;
Minim minim;
FFT fftLin;
float vectormedias[]=new float[6];
float magnitud=4;
float volumen;
int volcaptado;
void setup()
{
println(Serial.list());
if (port==null)
port = new Serial(this, Serial.list()[1], 9600);
size(512, 300, P3D);
volumen=1;
minim = new Minim(this);
jingle = minim.loadFile(“Goalscored.mp3”, 1024);
jingle.loop();
fftLin = new FFT(jingle.bufferSize(), jingle.sampleRate());
fftLin.linAverages(240);
rectMode(CORNERS);
}
void draw()
{
background(0);
fftLin.forward(jingle.mix);
noStroke();
fill(255);
int w = int(width/6);
for(int i = 0; i < 120; i++)
{
if (i<=1)
{
if (vectormedias[0]<2*fftLin.getAvg(i))
vectormedias[0]=2*fftLin.getAvg(i);
}
else if (i<=5)
{
if (vectormedias[1]<1.2*fftLin.getAvg(i))
vectormedias[1]=1.2*fftLin.getAvg(i);
}
else if (i<=12)
{
if (vectormedias[2]<1.6*fftLin.getAvg(i))
vectormedias[2]=1.6*fftLin.getAvg(i);
}
else if (i<=22)
{
if (vectormedias[3]<1.75*fftLin.getAvg(i))
vectormedias[3]=1.75*fftLin.getAvg(i);
}
else if (i<=55)
{
if (vectormedias[4]<2*fftLin.getAvg(i))
vectormedias[4]=2*fftLin.getAvg(i);
}
if (i<=200)
{
vectormedias[5]=i*fftLin.getAvg(i)/300+vectormedias[5];
}
if (i==119)
{
for (byte k=0;k<6;k++)
{ delay(10);
fill(255);
if (jingle.mix.level()>0.001)
{
volumen=volumen*0.998+jingle.mix.level()*0.002*10;
volcaptado=int(magnitud*vectormedias[k]/volumen);
volcaptado=300;
volcaptado=volcaptado/10;
port.write((k<<5)|byte(volcaptado));
rect(k*w, height, k*w + w, height – magnitud*vectormedias[k]/volumen);
}
else{
volumen=0.4;
port.write((k<<5));
delay(100);
}
vectormedias[k]=0;
}
}
}
}
void stop()
{
jingle.close();
minim.stop();
super.stop();
port.write(0);
}
Arduino Code
const int vectledPin[]={3,5,6,9,10,11};
const int vectbright[]={0,1,2,3,4,6,8,19,14,18,22,27,32,38,47,56,66,76,86,96,105,114,122,130,138,148,162,190,222,255,255};
int i=0;
void setup()
{
Serial.begin(9600);
for (i=0;i<6;i++)
pinMode(vectledPin[i], OUTPUT);
i=0;
}
void loop() {
byte brightness;
byte led;
if (Serial.available()) {
brightness = Serial.read();
led=(brightness>>5);
brightness=((brightness)&0x1F);
analogWrite(vectledPin[led], vectbright[brightness]);
}
}
Result
For my mockup of the project I first created a system that just used LED lights that would change brightness towards for the frequency bands. These lights I planned on replacing later with the LED strip lighting. The image below shows the setup with arduino to make this work (Image 4).
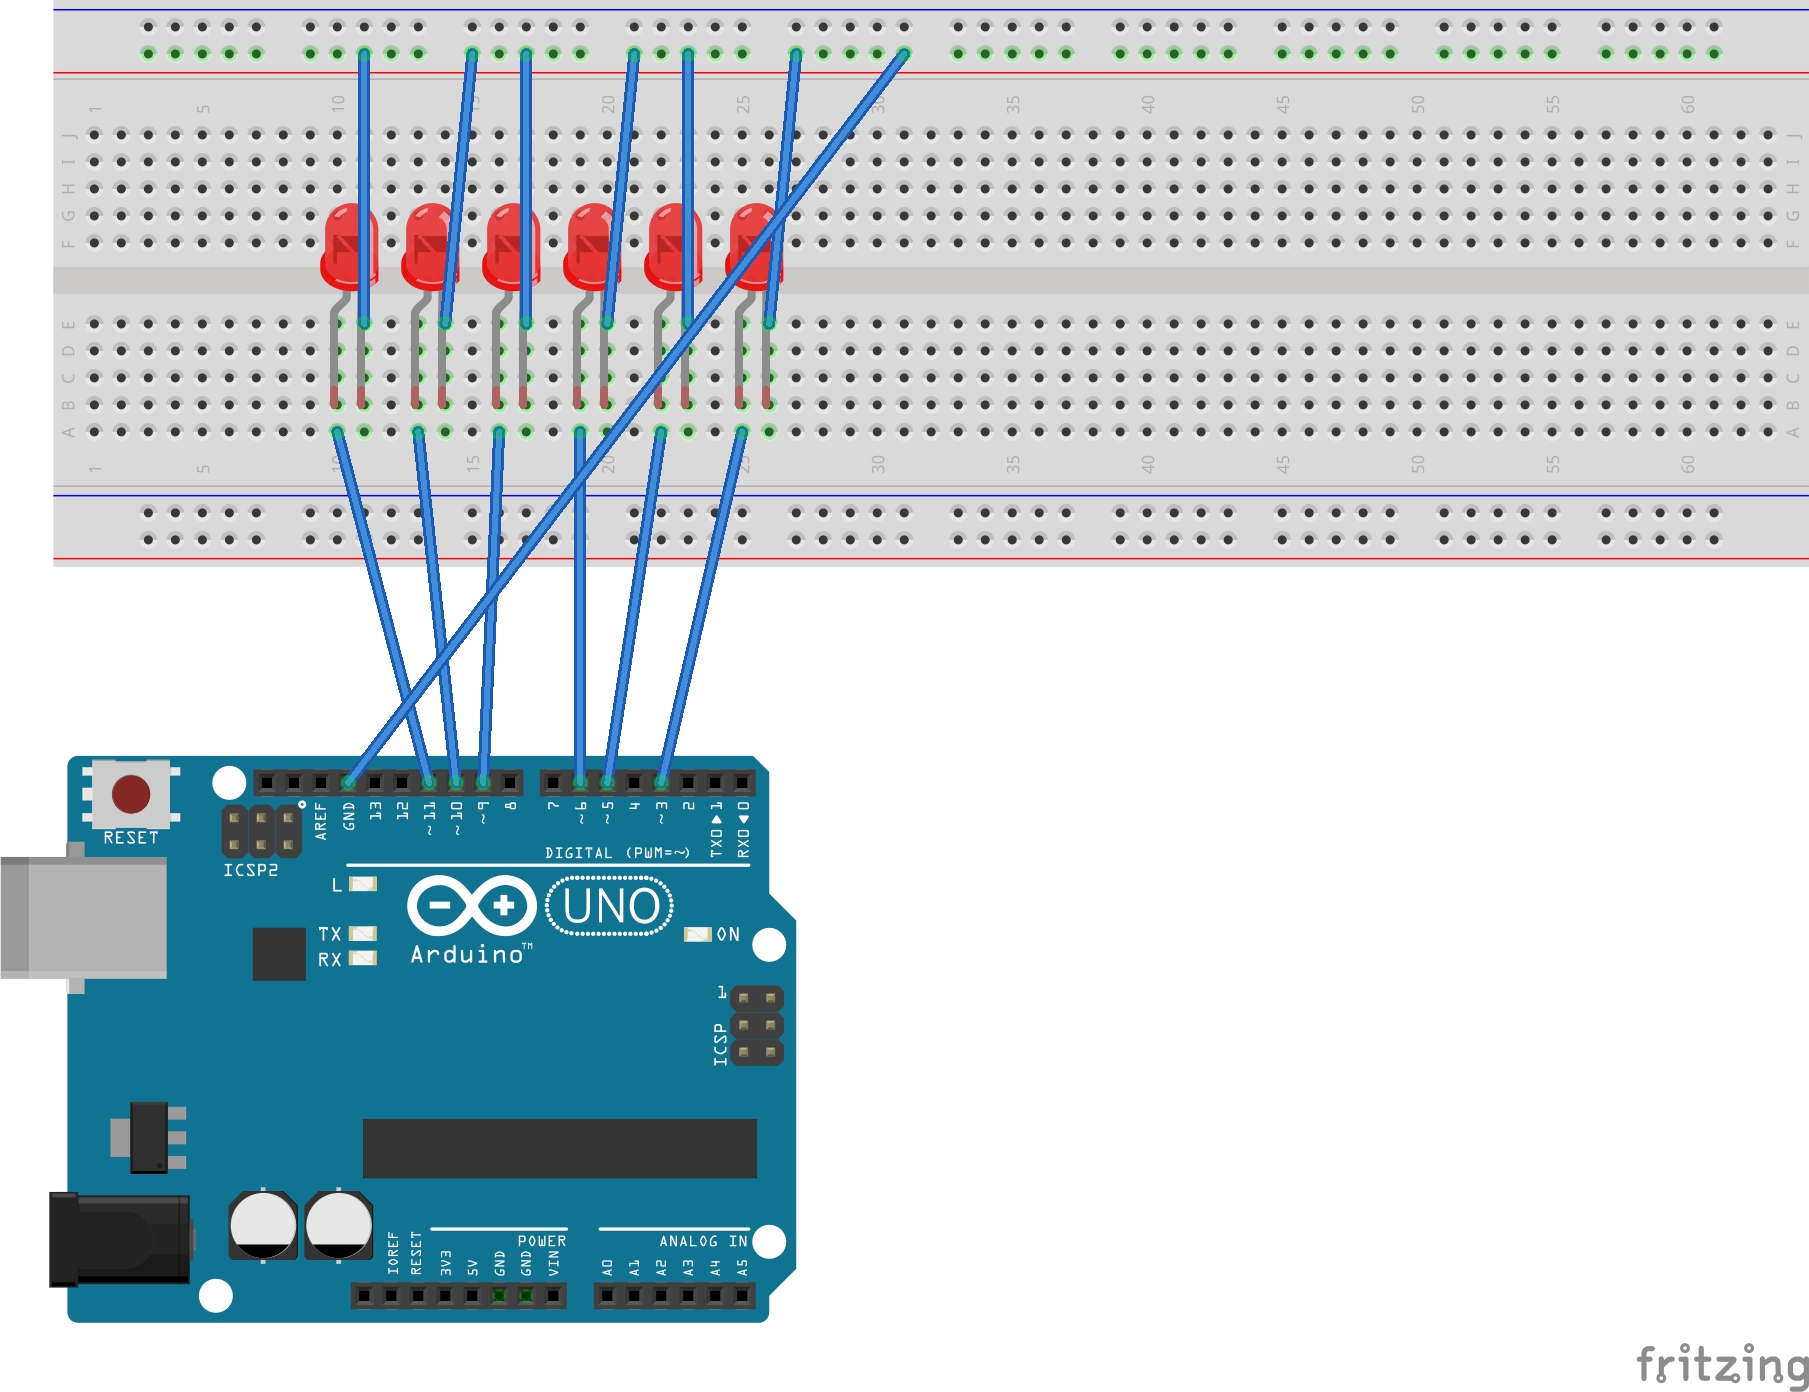
Image 4
The issue I ended up running into was that there was not enough power from the arduino to power the LED strip lights that required 12 volts. In the future I would have to make sure that I get a low enough voltage LED strip lights to run with arduino, and lights that run specifically with arduino. Under further reaserch of LED strip lighting I found that were strip lights that went specifically with arduino that you were allowed to change the code to create varying lighting. But, in the end I was only able to get the LED lights to work, after trying various different types of solution.